|
Glass Density Evidence
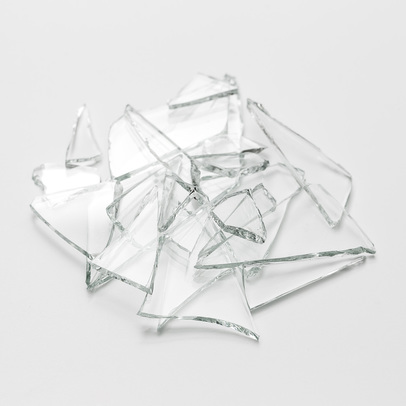
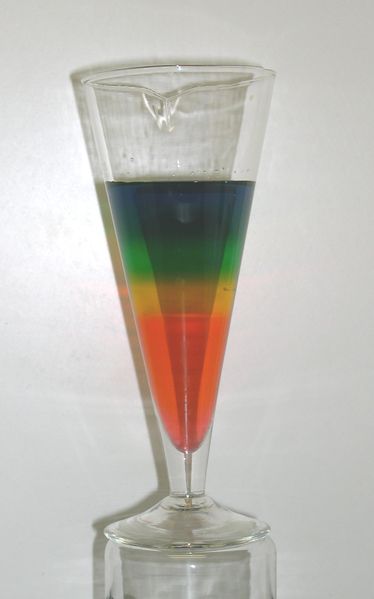
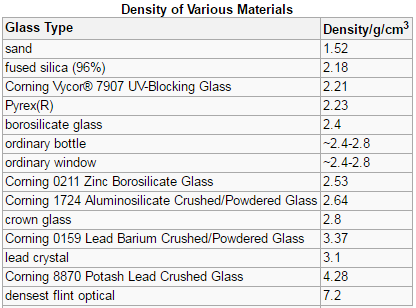
From ChemPRIME Sometimes identifying one type of glass or glass fragment at a crime scene may be critical in solving a crime, but the largest database [1] includes 304,107 glass compositions, so identifying one of them can be daunting. Although chemists can identify glass by more conclusive methods involving elemental analysis, density may still be used as a screening method, as FBI documents indicate FBI Glass Density. Density can be used to identify smashed glass at the scene of a crime. [2]. Densities of dozens of glasses are known [1]. The most common type of glass is ordinary window or bottle glass. It's called soda-lime glass because it is made of sodium carbonate (Na2CO3) and CaO (calcium oxide or lime) in addition to silica (sand or quartz, (SiO2). Pyrex (the Corning brand of borosilicate glass, about 70% silica, 10% boron oxide (B2O3), 8% sodium oxide, 8% potassium oxide, and 1% calcium oxide).Glass densities are determined by an ASTM standard method involving flotation in liquids [3], but the density of glass fragments can also be measured by water displacement, as described below. The ASTM flotation method is interesting. A layer of "heavy" bromoform is first added to a cylinder. It has a density of 2.889 g/cm3 at 15 °C, so most common glasses will float on its surface. Next, a layer of 20% ethanol in bromoform is carefully floated on the bromoform. Ethanol is light, having a density of 0.789 g/cm3, so when it's mixed with bromoform, the resulting solution is just a bit denser than bromoform. Layers of 40%, 60%, and 80% ethanol in bromoform, followed by 100% ethanol are added, and the layers are allowed to sit overnight. They diffuse into one another, giving a gradually changing density from 0.789 to 2.889 g/cm3. When glass pieces are added, they float at the level where the density matches. A density gradient column can be created with sugar solutions in dyed water [4], as shown in the figure to the left. |
Skill One: Measuring
|
Skill Two: Graphing Density,
|
For a 24 point SUMMATIVE GRADE, you will need to submit:
1) Data Table (1-2-3-4)
2) Graph (1-2-3-4)
3) Equation of the trendline (1-2-3-4)
4) Claim (1-2-3-4)
5) Evidence (1-2-3-4)
6) Reasoning (1-2-3-4)
1) Data Table (1-2-3-4)
2) Graph (1-2-3-4)
3) Equation of the trendline (1-2-3-4)
4) Claim (1-2-3-4)
5) Evidence (1-2-3-4)
6) Reasoning (1-2-3-4)


